Safe Work Australia has released their annual Fact Sheet on the mining sector, analysing national statistics from the 2011-12 financial year. The findings make for very interesting reading:
[hr]Overview
The mining industry employed 245,000 people in 2011–12 (2% of the Australian workforce).
Within mining, 82% of workers were employees and covered by workers’ compensation.
Employers in mining paid 1.3% of payroll in 2011–12 to provide workers’ compensation coverage for their employees.

Fatalities
Over the five years from 2007–08 to 2011–12, 36 mining workers died from work-related
injuries—21 of which involved a vehicle. The total number of deaths equates to 3.84 fatalities per 100,000 workers, which is almost 70% higher than the national rate of 2.29.
- Vehicle incidents accounted for 8 fatalities. In 4 incidents the worker was in a car, in 2 the worker was in a truck, 1 was in an excavator and 1 was in a track maintenance machine at the time of the incident.
- Falls from heights accounted for 5 fatalities. Of these, 2 fell down a shaft, 1 fell from a building or walkway, 1 fell from a ladder and 1 fell from a truck.
- Being hit by falling objects accounted for 5 fatalities. These all involved different types of objects.
- Being hit by moving objects accounted for 4 fatalities and Slide or cave-in accounted for 3.
Serious Claims
The preliminary data for 2011–12 shows there were 3,365 successful workers’ compensation claims for serious injury or illness. Over the five years from 2007–08 to 2011–12, the mining industry accounted for 2% of all serious workers’ compensation claims. On average there were 8 claims each day from employees who required one or more weeks off work because of work-related injury or disease.
Figure 1 shows that the incidence rate of serious claims in the Mining industry has fallen 51% from 29.8 claims per 1000 employees in 2000–01 to 14.6 in 2010–11. This rate is slightly higher than the rate for all industries (12.7 claims per 1000 employees). Between 2007–08 and 2011–12:
- Body stressing accounted for 34% of claims—many of these claims were due to muscular stress while handling .
- Falls, trips and slips accounted for 22% of claims with more than half involving falling over objects on the ground or on slippery surfaces.
- Being hit by moving objects accounted for 18% of claims—the most common causes being hit by metal objects such as bars, pipes, beams or by rocks, stones and boulders.
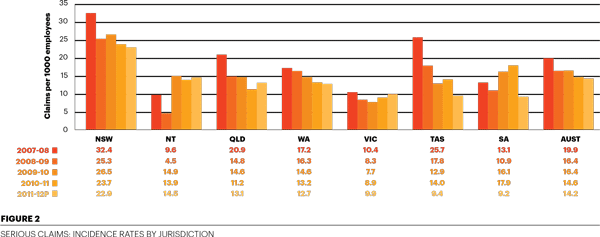
Serious claims by jurisdiction
Figure 2 shows the incidence rates of serious claims in the mining industry by jurisdiction.
Over the period 2007–08 to 2010–11 all jurisdictions except the Northern Territory and South Australia recorded falls in incidence rates. The largest falls were recorded by Queensland and Tasmania (both 46%) followed by New South Wales (27%). The Northern Territory and South Australia recorded substantial increases (45% and 37% respectively).
The preliminary data for 2011–12 show that New South Wales recorded the highest incidence rate with 22.9 serious claims per 1000 employees and South Australia recorded the lowest with 9.2.
Claims involving 12 or more weeks time lost by jurisdiction
Figure 3 shows the incidence rates of claims involving 12 or more weeks off work by jurisdiction.
Preliminary data for 2011–12 show 25% of serious claims had compensation paid for 12 or more weeks off work.
Over the period 2007–08 to 2010–11 all jurisdictions except South Australia and the Northern Territory recorded falls in the incidence rates of long term claims. Queensland recorded the largest decrease (43%) followed by New South Wales (27%). In contrast, incidence rates of long term claims have more than doubled since 2007–08 in the Northern Territory and South Australia.
The preliminary data for 2011–12 show that incidence rates of long term claims ranged from 1.7 claims per 1000 employees in Victoria to 4.4 in the Northern Territory.
Claims data were extracted from the National Data Set (NDS) for Compensation-based Statistics. The data presented here are restricted to accepted claims for serious injury and disease. Serious claims include fatalities, claims for permanent disability and claims for conditions that involve one or more weeks of time lost from work. Serious claims do not include those involving journeys to and from work. The 2011–12 data are preliminary and expected to rise. As such they have not been used to determine the percentage change in rates over time. More information on this industry can be found at swa.gov.au.

Information on fatalities is extracted from the Traumatic Injury Fatalities database. Annual fatalities reports can be found at swa.gov.au.


Add Comment